
A golf ball compression chart can help. It just cannot make the final call for you.
Use it to compare published values within the same test method. A compression number alone can’t tell you which ball will fly farther or stop better for you.
What golf ball compression means
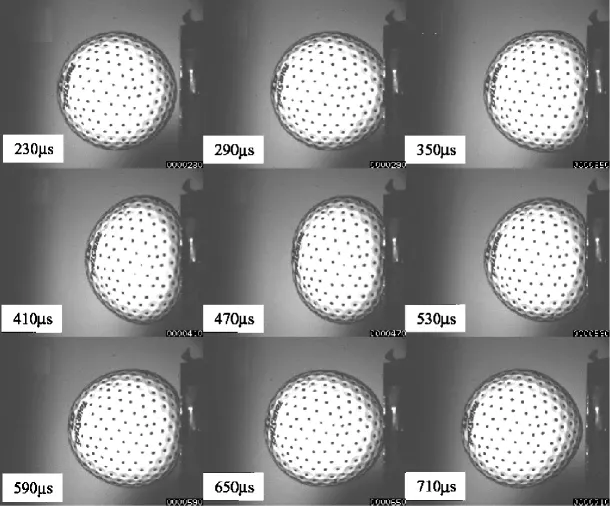
A compression rating describes how stiff or soft a golf ball is under a particular test. It is different from watching the ball deform against the clubface at impact. Higher readings generally mean a firmer ball when the same measurement method is used, as MyGolfSpy’s Ball Lab explains.
That still does not make the number a universal buying rule. There is no single industry-standard gauge, so one manufacturer’s 90 may not match another manufacturer’s 90. It also matters whether the number describes the whole ball or only the core. If that sounds familiar, it is the same pattern as chasing the right shaft flex, where the label on the box is less consistent than it looks.
Golf ball compression chart
These are examples of published compression values. Check the model year and the source before comparing a number with a ball in your bag.
Read these as two separate sets. The first uses measurements from MyGolfSpy’s Ball Lab. The second lists manufacturers’ own specifications, which may use different equipment or methods. A number from one set is not a like-for-like comparison with a number from the other.
Independent measurements: MyGolfSpy Ball Lab
| Ball | Compression | How the value was reported |
|---|---|---|
| Callaway Chrome Tour, 2026 | 91 | MyGolfSpy Ball Lab |
| TaylorMade TP5, 2026 | 91.5 | MyGolfSpy Ball Lab |
| Titleist Pro V1, 2025 | 92.5 | MyGolfSpy Ball Lab |
| Bridgestone TOUR B X, 2026 | 98.5 | MyGolfSpy Ball Lab |
| Titleist Pro V1x, 2025 | 101 | MyGolfSpy Ball Lab |
Manufacturer-published specifications
| Ball | Compression | How the value was reported |
|---|---|---|
| Wilson DUO Soft | 37 | Whole-ball specification from Wilson Australia |
| TaylorMade Soft Response | 50 overall | Overall ball, not the 30 core figure. TaylorMade |
Compression figures describe the tested model or stated specification. Individual balls can vary, and a new version of the same model can change. A small difference in the chart does not tell you which ball will fly farther or stop better for you. Sources checked October 3, 2026.
What the chart can tell you
The chart can give you a rough sense of firmness. It can also show you why a label can be misleading. The 2025 Pro V1 measures 92.5 in this data set, while the 2026 TP5 measures 91.5. Both are firm by that test, even though players may describe and use them differently.
That one-point difference doesn’t predict which will perform better for you. The TP5 product details report 91.5 while the article’s narrative rounds it to 92.
What the chart cannot tell you
It cannot tell you which ball will fly best with your driver, stop best with your irons, or feel right on short shots around the green.
It also cannot tell you whether you will trust that ball on a four-foot putt late in the round.
It certainly cannot tell you where your strokes are actually going. That takes measuring your own game rather than reading a spec.
What compression should I use for my swing speed?
There is no universal conversion from swing speed to a compression rating. Swing speed matters, but so do launch, spin and how the ball performs on the shots you play. Titleist explains why compression alone isn’t a fitting rule, and MyGolfSpy’s 2026 ball test compares performance across different swing speeds. Use a fitting recommendation to build a shortlist, then compare those balls with your current one.
Use the chart as a starting point
It’s nice to understand what golf ball compression is and using a chart to understand how different balls may compare. But if you are wanting to find the best ball for YOU, then do a quick online ball fitting.
That is what I did and how I selected the ball I use today.
I used Ball Fitting, (formerly Ballnamic), to enter my own data and where I play. It gave me real data based on loads of testing, and I changed balls as a result.
This will give you a lot better information than a golf ball compression chart.
Run a Ball FittingHere’s my ball fitting results (there’s a lot more data available once you do your own).
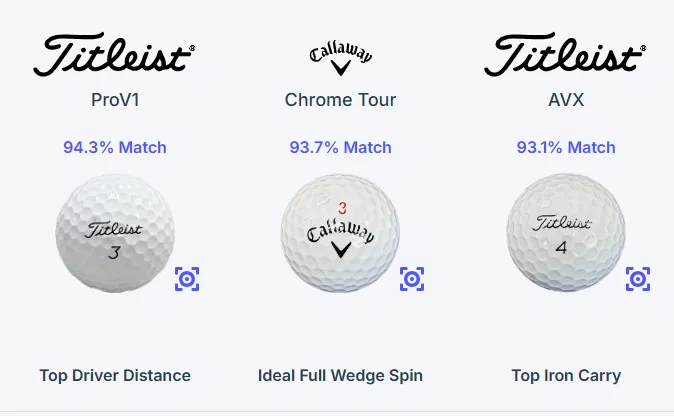
Compare a shortlisted ball with the one you normally play. Start with chips and pitches, then check your approach shots and driver. Look at carry, flight, how the ball stops, and whether you like the feel. Keep conditions as similar as you can and repeat the comparison before deciding one good shot has settled it. Your personal carry card gives you somewhere to record the distances you trust.
What deserves your practice time?
A ball comparison helps you choose what to play. If you also want a clearer practice focus, use the free Scoring Leak Finder in your next round. Record what happens, then use it to choose what to work on.
Get the free Scoring Leak FinderGet it by email, plus Weekend Golfing tips. Unsubscribe anytime.